xplain.ux.attribute.Window
A
xplain.ux.attribute.Window(or by it’s xtype xgrid) is a specialized window that basically takes an instance of Xplain.Db.Query as input, and depicts the result of this query as a table or bar chart. Please note, that before creating an xplain.ux.attribute.Window you have to open or execute the query (using the open or execute method). The result will basically look like this: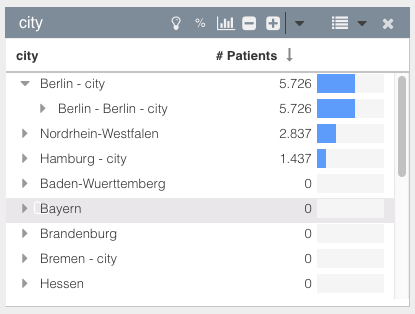
xgrid extends Ext.window.Window. Thus, an xgrid can be resized, closed, moved, etc.
Most of the config options are optional. However, some of them are obligatory:
forQuery to specify the source of data
parentComponent to specify where this window should be rendered
x to specify the x position of this window
y to specify the y position of this window
Config Parameters
- showColorMarker = false
If
truea color marker (triangle in the header of the window) will be shown. This marker indicates which to which ``selectionSet the query depicted in thiw window has been assigned.
- ajaxUrl = '/xplainsession'
The URL used for all Ajax requests executed by this window.
- ajaxTimeout = 0
The timeout in milliseconds used for all Ajax requests executed by this window. Defaults to
0where0means that no timeout is being set.
- request = null
If you want to depict the results of an Xplain.Db.Query instance, you should use the
forQueryconfig parameter. Otherwise, you may use therequestparameter which is the result of a query as returned by the backend, i.e. an object with for instance a groupBys etc.This parameter can only be used in combination with the requestId config parameter.
- disableErrorMessages = false
An instance of
xplain.ux.attribute.Windowwill (per default) show error messages usingExt.toastmessages. SetdisableErrorMessagestotrueto disable all error messages. Instead of using anExt.toastmessage, anxplainUXErrorMsgevent will be triggered. The first parameter of this event will consist of the corresponding error message.
- requestId = ''
If you want to depict the results of an Xplain.Db.Query instance, you should use the
forQueryconfig parameter. Otherwise, you may use therequestIdparameter which is the ID / name of the query as returned by the backend.This parameter can only be used in combination with the request config parameter.
- forQuery = null
If you want to depict the results of an
Xplain.Db.Queryinstance, you should use this config parameter. If the query has not yet been executed (using the open or execute method), thisxgridwill wait until the query gets executed.You might also pass a function as
forQueryinput parameter. This function has to return an instance ofXplain.Db.Query. If this function returns either a query that has not yet been executed or anything else than an instance ofXplain.Db.Query, thisxgridwill wait until this function returns an exected instance ofXplain.Db.Query.
- winTitle = ''
Title of this window.
- startWithMeasure = null
Name of the measure to start with.
This parameter only makes sense if startupMode parameter is set to chart. A chart is able to depict one measure at a time. This parameter may be set to start with a specific measure. By default, the first measure found will be depicted. The user may always switch to another measure using the corresponding menu.
- unwantedChartStates = []
An array of states (state names) that should not be shown on the x-Axis.
This parameter only makes sense if startupMode parameter is set to chart.
- autoTrim = false
If set to true, the chart will trim all states on the left and right that do have a value equal to zero.
This parameter only makes sense if startupMode parameter is set to chart.
- isStacked = null
If
truefullstacked mode will be turned on.This parameter only makes sense if startupMode parameter is set to chart. If set to
truethe chart will use the fullstacked mode turned on.
- chartTitle = null
The title of the chart. Not to be confused with the window title.
This parameter only makes sense if startupMode parameter is set to chart.
- yAxisConfig = null
The configuration of the yAxis. Only used if a) this is a chart window and b) the user has set a yAxis configuration. The yAxisConfig object contains of three properties: min, max and format.
This parameter only makes sense if startupMode parameter is set to chart.
- trendline = "none"
Type of the trendline shown in the chart. Possible values are
"linear"or"square"(for a square polynomial function) or or"none"(no trendline).This parameter only makes sense if startupMode parameter is set to chart. Furthermore, trendlines are only enabled if the corresponding query does NOT consists of any reference values, consists of only ONE group by and this group by has to be set to a time dimension. If one of these conditions does not apply, the trendline will be set to
none.
- isMenuEnabled = true
If
falsethis window will have no menu. In contrast to the hideElements parameter, this one is useful when you would like to completely disable the menu.
- hideElements = []
An array of button and menu references. These buttons / menu items will be hidden. Use isMenuEnabled instead, if you would like to completely disable the menu.
Valid references are defined as statics in this class and are:
Buttons
xplain.ux.attribute.Window.WIN_BUTTON_TOGGLEPCTBUTTON
xplain.ux.attribute.Window.WIN_BUTTON_CHARTTOGGLE
- xplain.ux.attribute.Window.WIN_BUTTON_USERDEFINEDBTN
xplain.ux.attribute.Window.WIN_BUTTON_CREATESEQUENCE
xplain.ux.attribute.Window.WIN_BUTTON_CLEARSELECTION
xplain.ux.attribute.Window.WIN_BUTTON_SETSELECTION
Menu items
- xplain.ux.attribute.Window.WIN_MENU
xplain.ux.attribute.Window.WIN_MENUITEM_CHARTOPTIONS
xplain.ux.attribute.Window.WIN_MENUITEM_CHARTMEASURE
xplain.ux.attribute.Window.WIN_MENUITEM_SHOWWHAT
xplain.ux.attribute.Window.WIN_MENUITEM_EXCELEXPORT
xplain.ux.attribute.Window.WIN_MENUITEM_ADDAGGREGATION
xplain.ux.attribute.Window.WIN_MENUITEM_FORMAT
xplain.ux.attribute.Window.WIN_MENUITEM_INSERT
xplain.ux.attribute.Window.WIN_MENUITEM_ATTRIBUTEFROMSELECTION
xplain.ux.attribute.Window.WIN_MENUITEM_EXPANDTOLEVEL
- useCheckboxSelections = false
if
truean additional column with checkboxes will be shown. The user may use these checkboxes to select / unselect rows.NOTE: this feature currently only works if the underlying query consists of exactly one groupBy and one aggregation.
- width = 400
The width of this window. A numeric value will be interpreted as the number of pixels; a string value will be treated as a CSS value with units.
- height = 300
The height of this window. A numeric value will be interpreted as the number of pixels; a string value will be treated as a CSS value with units.
- x = null
Initial x position of this window in pixels. This x value is relative to the parentComponent.
- y = null
Initial y position of this window in pixels. This y value is relative to the parentComponent.
- columnsWidth = []
An array that defines the width of all columns. The width itself may be defined as string or as numeric value. Thus, the following would define that the first column has a width of 20% and the second column has a width of 200 pixels: [“20%”, 200]
- showRefRed = true
If
truereference values tagged asredwill be shown. The color used is defined using the colorRefRed parameter.
- colorRefRed = "#E3405C"
The color used to depict reference values tagged as
red. Will only be used if showRefRed is set totrue.
- showRefBlue = true
If
truereference values tagged asbluewill be shown. The color used is defined using the colorRefBlue parameter.
- colorRefBlue = "#57a7ff"
The color used to depict reference values tagged as
blue. Will only be used if showRefBlue is set totrue.
- showRefGreen = true
If
truereference values tagged asgreenwill be shown. The color used is defined using the colorRefGreen parameter.
- colorRefGreen = "#589999"
The color used to depict reference values tagged as
green. Will only be used if showRefGreen is set totrue.
- colorSelected = "#FFC65B"
The color used to depict selected states. Color has to be given as a string value which will be treated as a CSS value.
- colorSemiSelected = "#FFE8BC"
The color used to depict semi-selected states (states that are not selected but where at least one child-state is selected). Color has to be given as a string value which will be treated as a CSS value.
- colorBar = '#D9D9D9'
The color used to depict a bar. Color has to be given as a string value which will be treated as a CSS value.
- showValuesAs = 'abs'
Show values as absolute or relative values. May be set to
absorrel.
- userDefinedButton = null
Currently, one button in this window’s header component may be set as user defined button. For instance, the ObjectExplorer uses this button as
Start Predicition Modelbutton.The button has to be defined as an object with the following parameters: -
iconClsthe iconCls as used by ExtJS. Defines, which icon should be used. -firesEventa string that defines which event will be fired when this button is being clicked. You may then catch this event and trigger your action. -tooltipthe tooltip that should be depicted when the mouse hovers this button’s icon.For instance, a valid userDefinedButton object could look like this:
 userDefinedButton: {
    iconCls: 'fa fa-lightbulb-o buttonIcon',
    firesEvent: 'onXplainClicked',
    tooltip: 'I am your tooltip'
 },


.. py:attribute:: userDefinedMenuItems
   :value: null
An array of menu items that will be attached to this windows menu. Each item has to be an instance of Ext.menu.Item. For instance, you could add a menu item like this:
 userDefinedMenuItems: [{
     text: 'my menu item',
     iconCls: 'fa fa-clone',
     handler: function() {alert("Hello!")},
 }]


.. py:attribute:: parentComponent
   :value: null
ID of the parent container to which this window will be rendered. If you are programming an XOE Application, this parameter may be skipped
- startupMode = 'table'
Defines the startup mode of this window.
The user may switch between depicting data as a table, a chart, a combobox, a list of radio buttons or a tagfield. By default, the startup mode is set to
table. You may use this config parameter to switch tochart,radio,comboor atag
- radioColumns = 2
If data is shown as a set of radio boxes, this parameter defines the number of columns used. 0 = show radio boxes horizontally, 1 = show radio boxes vertically with one column, 2 = two columns, 3 or greater = three columns.
- startOnLevel = null
If startup mode (see startupMode) is set to
chart, you may use this parameter to start a specific hierarchy level, e.g. start on the level of “Months” instead of “Years”. Use this parameter to define the name of the level you would like to start, e.g.MonthsATTENTION: It’s up to you to fetch all necessary data in advance. Usually, you will need something like this:
// myQuery is an instance of Xplain.Db.Query
myQuery.open({
   success: function() {
      var session = new Xplain.Db.Session();
      session.request({method: "expandToLevel", requestName: myQuery.getId(), levelName: "Quarters"}, {
          success: function() {
              // this is where you should create a new
              // instance of xplain.ux.attribute.Window
          }
    }
});
This would 1) open a query that loads all data on the appropriate level and 2) depict this query using an instance of
xplain.ux.attribute.windowwithin thesuccessfunction.
- showLegend = true
If
true, the chart contains a legend. Note, that a legend will only be shown if this chart depicts a value on the z-Axis.
- hadWidth = null
The width of the window had before it has been minimized. Is only taken into consideration, if isMinimized it true.
- hadHeight = null
The height of the window had before it has been minimized. Is only taken into consideration, if isMinimized it true.
- hadX = null
The X position of the window had before it has been minimized. Is only taken into consideration, if isMinimized it true.
- hadY = null
The Y position of the window had before it has been minimized. Is only taken into consideration, if isMinimized it true.
- isMinimized = false
If
true, the window will start minimized.
- uiWindow = 'default'
the UI style for this window. This may be used in collaboration with the Semcha Themer to alter the layout of this window.
- uiHeaderButton = 'default'
the UI style for this windows header buttons. This may be used in collaboration with the Semcha Themer to alter the layout of this window.
- format = null
A set of functions that define how numerical values will be rendered in this window. This parameter has to be an object that consists of one or two of the following properties:
absa function or string that defines how absolute values will be rendered.rela function or string that defines how relative values will be rendered. For instance, you might use something like:format: { abs: function(v, currAggregation, attributeName, currState) { if (currAggregation == 'SUM(costs)') return Ext.util.Format.number(v, '0,000') + " USD"; else return Ext.util.Format.number(v, '0,000'); } } Alternatively, you may provide a format string instead of a format function (for more details on valid format strings see `Ext.util.Format <https://docs.sencha.com/extjs/6.0.2/modern/Ext.util.Format.html#method-number>`_:: format: { abs: '0,000.00 USD' } If you provide the format as a string, you have to differentiate between US/UK number formatting (e.g. 123,456.78) and European number formatting (e.g. 123.456,78). By default, the formatting string will be interpreted as US/UK formatting. If you would like to use European formatting you have to terminate the formatting string with a "``/i``". For instance:: format: { abs: '0.000,00/i' }You have to set the corresponding ExtJS specific settings in your application. This means that if you want to use the European formatting of numbers, you have to set corresponding separators somewhere in your application:
Ext.util.Format.thousandSeparator = '.';
Ext.util.Format.decimalSeparator = ',';
See ExtJS documentation for more details.
- sortOrder = false
Sort this window on startup. Has to be an object with two parameters:
column: the column-index, e.g.
# Patients.direction: either
ASCorDESCorNONE
- usernotes = []
An array of notes, set by the user. Each entry in this array is a note for one cell in the table. For instance:
[{
   groupById: "# Patients",
   state: "Male",
   text: "The note itself"
},
...]
This would add a note to the column for the groupBy with the ID “# Patients” and the state “Male”.
- isInteractive = true
If set to
truethis window will respond to clicks to trigger a selection or start a drill-down.
- showOnlyStates = false
If set to
true, all columns except the 1st column (showing the states) will be hidden.
- filterStates = []
An array of states (state names) you would like to filter out from the result. These states will NOT be shown in the xgrid. Note: currently, this will only filter top level states.
- disableTotal = false
If set to
true, the total will NOT be shown.
- innerBorder = false
If true, a border around the tree within this window will be used.
- expandableTillLevel = 0
You may use this parameter to define a max level till which the user may expand the attribute hierarchy.
1is the topmost level (root level),2the level below the root level, etc. A value of0means there will be no limitation.
- tableMode = 'separate'
Mode of the table. Either
separateoroverlay. If set toseparate, you manually have to adapt your CSS files.
- chartMode = 'column'
The modus the user used to depict data in a chart. One of “column”, “area”, “line” or “pie”.
- showBar = true
If set to
truehistogram bars will be used to depict the data within this window on startup. The user may use the corresponding menu to toggle betweentrueandfalse, i.e. to show / hide histogram bars.
- showRowSums = false
If set to
true, a column showing the sum of the row will be added.An array of column names, i.e. IDs of Xplain.Db.Aggregation, for which you want to hide all rows where the corresponding aggregation value equals 0. For instance, [”# Patients”] would hide all rows where the value in the “# Patients” column equals zero.
- showRowSums = false
If set to true, the total for each row will be shown in the table.
- normalizationMode = undefined
Sets the way the percentage values are being computed. If set to “row” the percentage values will be normalized along the row. If set to “column” the percentage values will be normalized along the column. Only applicable, if parameter showRowSums is set to true.
closeWindow
- closeWindow(callback)
closes this window. If defined a callback function is being triggered after this window and the corresponding query have been closed successfully.
- Parameters
callback (function) – Function that is being triggered after this window and the corresponding query have been closed.
disableMinimize
- disableMinimize()
hide the minimize button in the header
getForQuery
- getForQuery()
returns the value of the
forQueryparameter. IfforQueryhas been set as function, the return value of this function (i.e. an instance ofXplain.Db.Query) will be returned.- Returns
{Xplain.Db.Query} the query depicted by this window
getQuery
- getQuery()
basically a shorthand for getForQuery() - returns the query used within this window
- Returns
{Xplain.Db.Query} the query depicted by this window
getSelectedStates
- getSelectedStates()
Returns an array of all selected states. Note: this will NOT return a list of all states selected on the backend but instead return a list of all states (on the left side of a xgrid) the user marked as “ready for selection”
- Returns
{Array} all selected states
getStoreSelections
- getStoreSelections()
Returns an array of all selected states. Note: this will return all states on which currently an XplainDB selection has been set.
- Returns
{Array} all selected states
queryExecuted
- queryExecuted()
This function will return
trueif the underlying query has already been executed or opened.- Returns
{boolean}
trueif the underlying query has already been executed or opened
Methods
setMarkerColor
- setMarkerColor(the)
sets the color of the marker area (the triangle in the header of a window).
- Parameters
the (string) – new color as CSS string, e.g. “#FF01A3” or “red”;
setQuery
- setQuery(the)
Assigns a new query to this window. This query has to be an opened query…
- Parameters
the (Xplain.Db.Query) – new query
spreadsheetExport
- spreadsheetExport()
Triggers the export of all data currently depicted in this window into an Excel sheet.