3. Release Notes
2.10.1 XNotebook replaced the Scripts
Release Date: 23 Jan 2026
XNotebook: Interactive Script Development
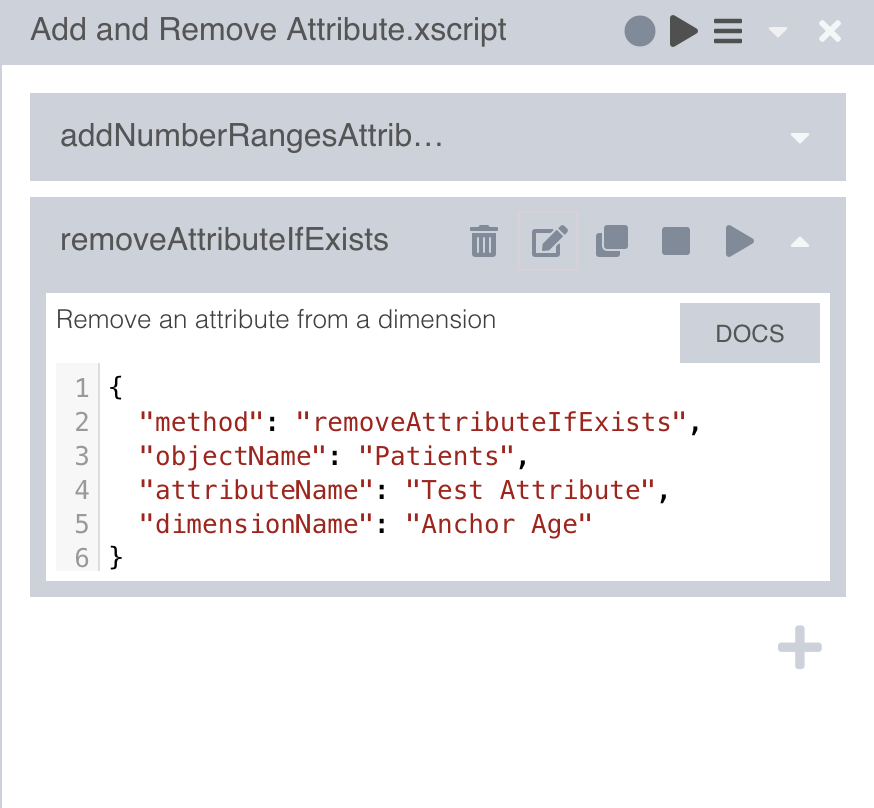
The new XNotebook provides an intuitive interface for generating, editing, and executing Xplain Data scripts. XNotebook replaced the current Scripts menu, providing a unified scripting environment. Unlike traditional script execution, XNotebook enables:
Step-by-step execution: Run commands one at a time to observe their effects.
Out-of-order execution: Explore logic paths without linear constraints.
This feature is ideal for interactive analysis, debugging, and educational walkthroughs of script-based workflows.
Left Join Method: Cross-Branch Object Analytics is available again
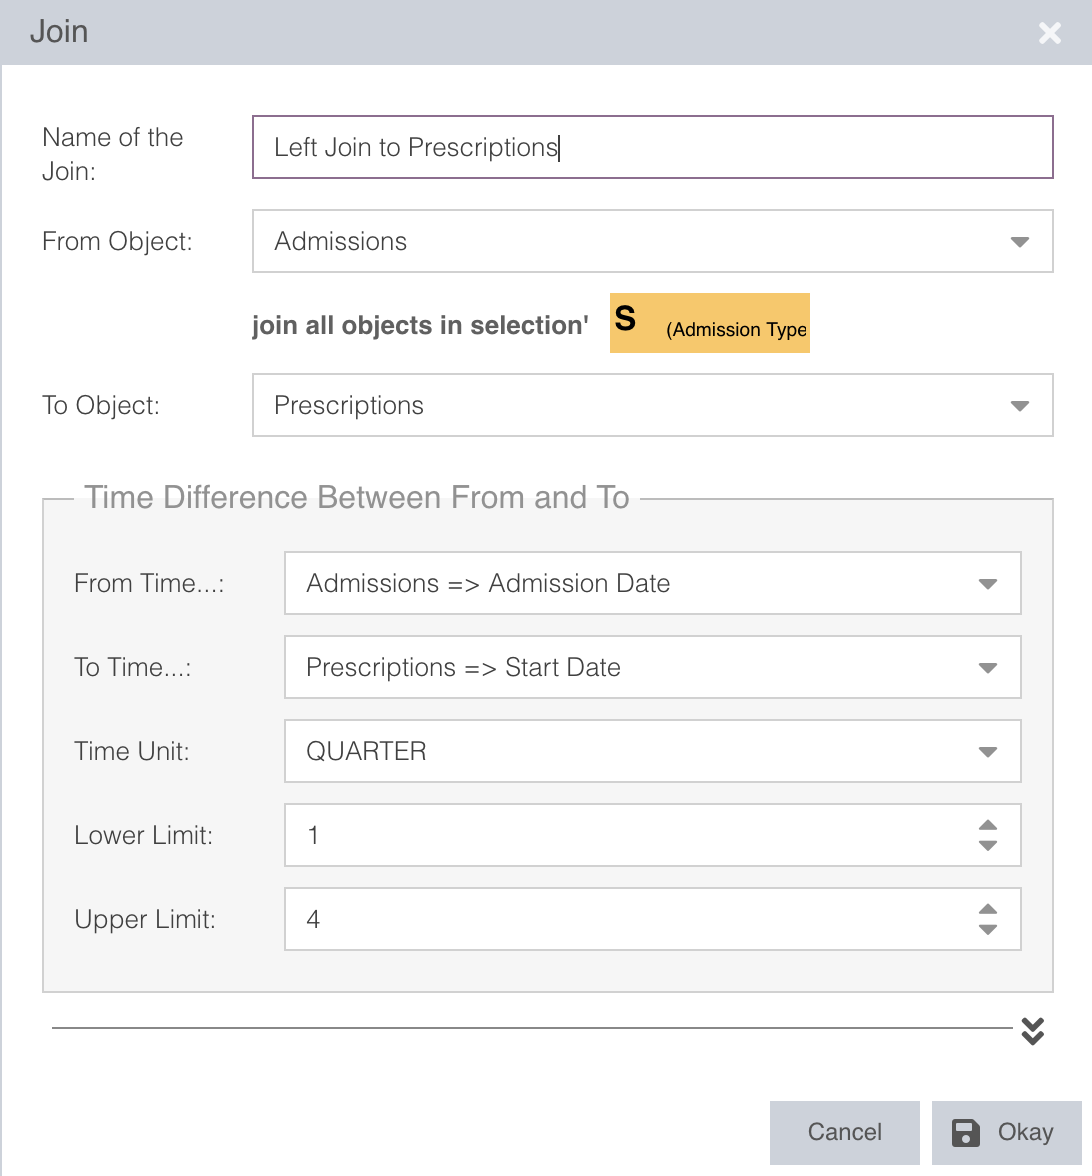
The left join method is now available again after the bugfix.
2.7.0 Join, XNotebook, and Enhanced Solution Builder
Join Method: Cross-Branch Object Analytics
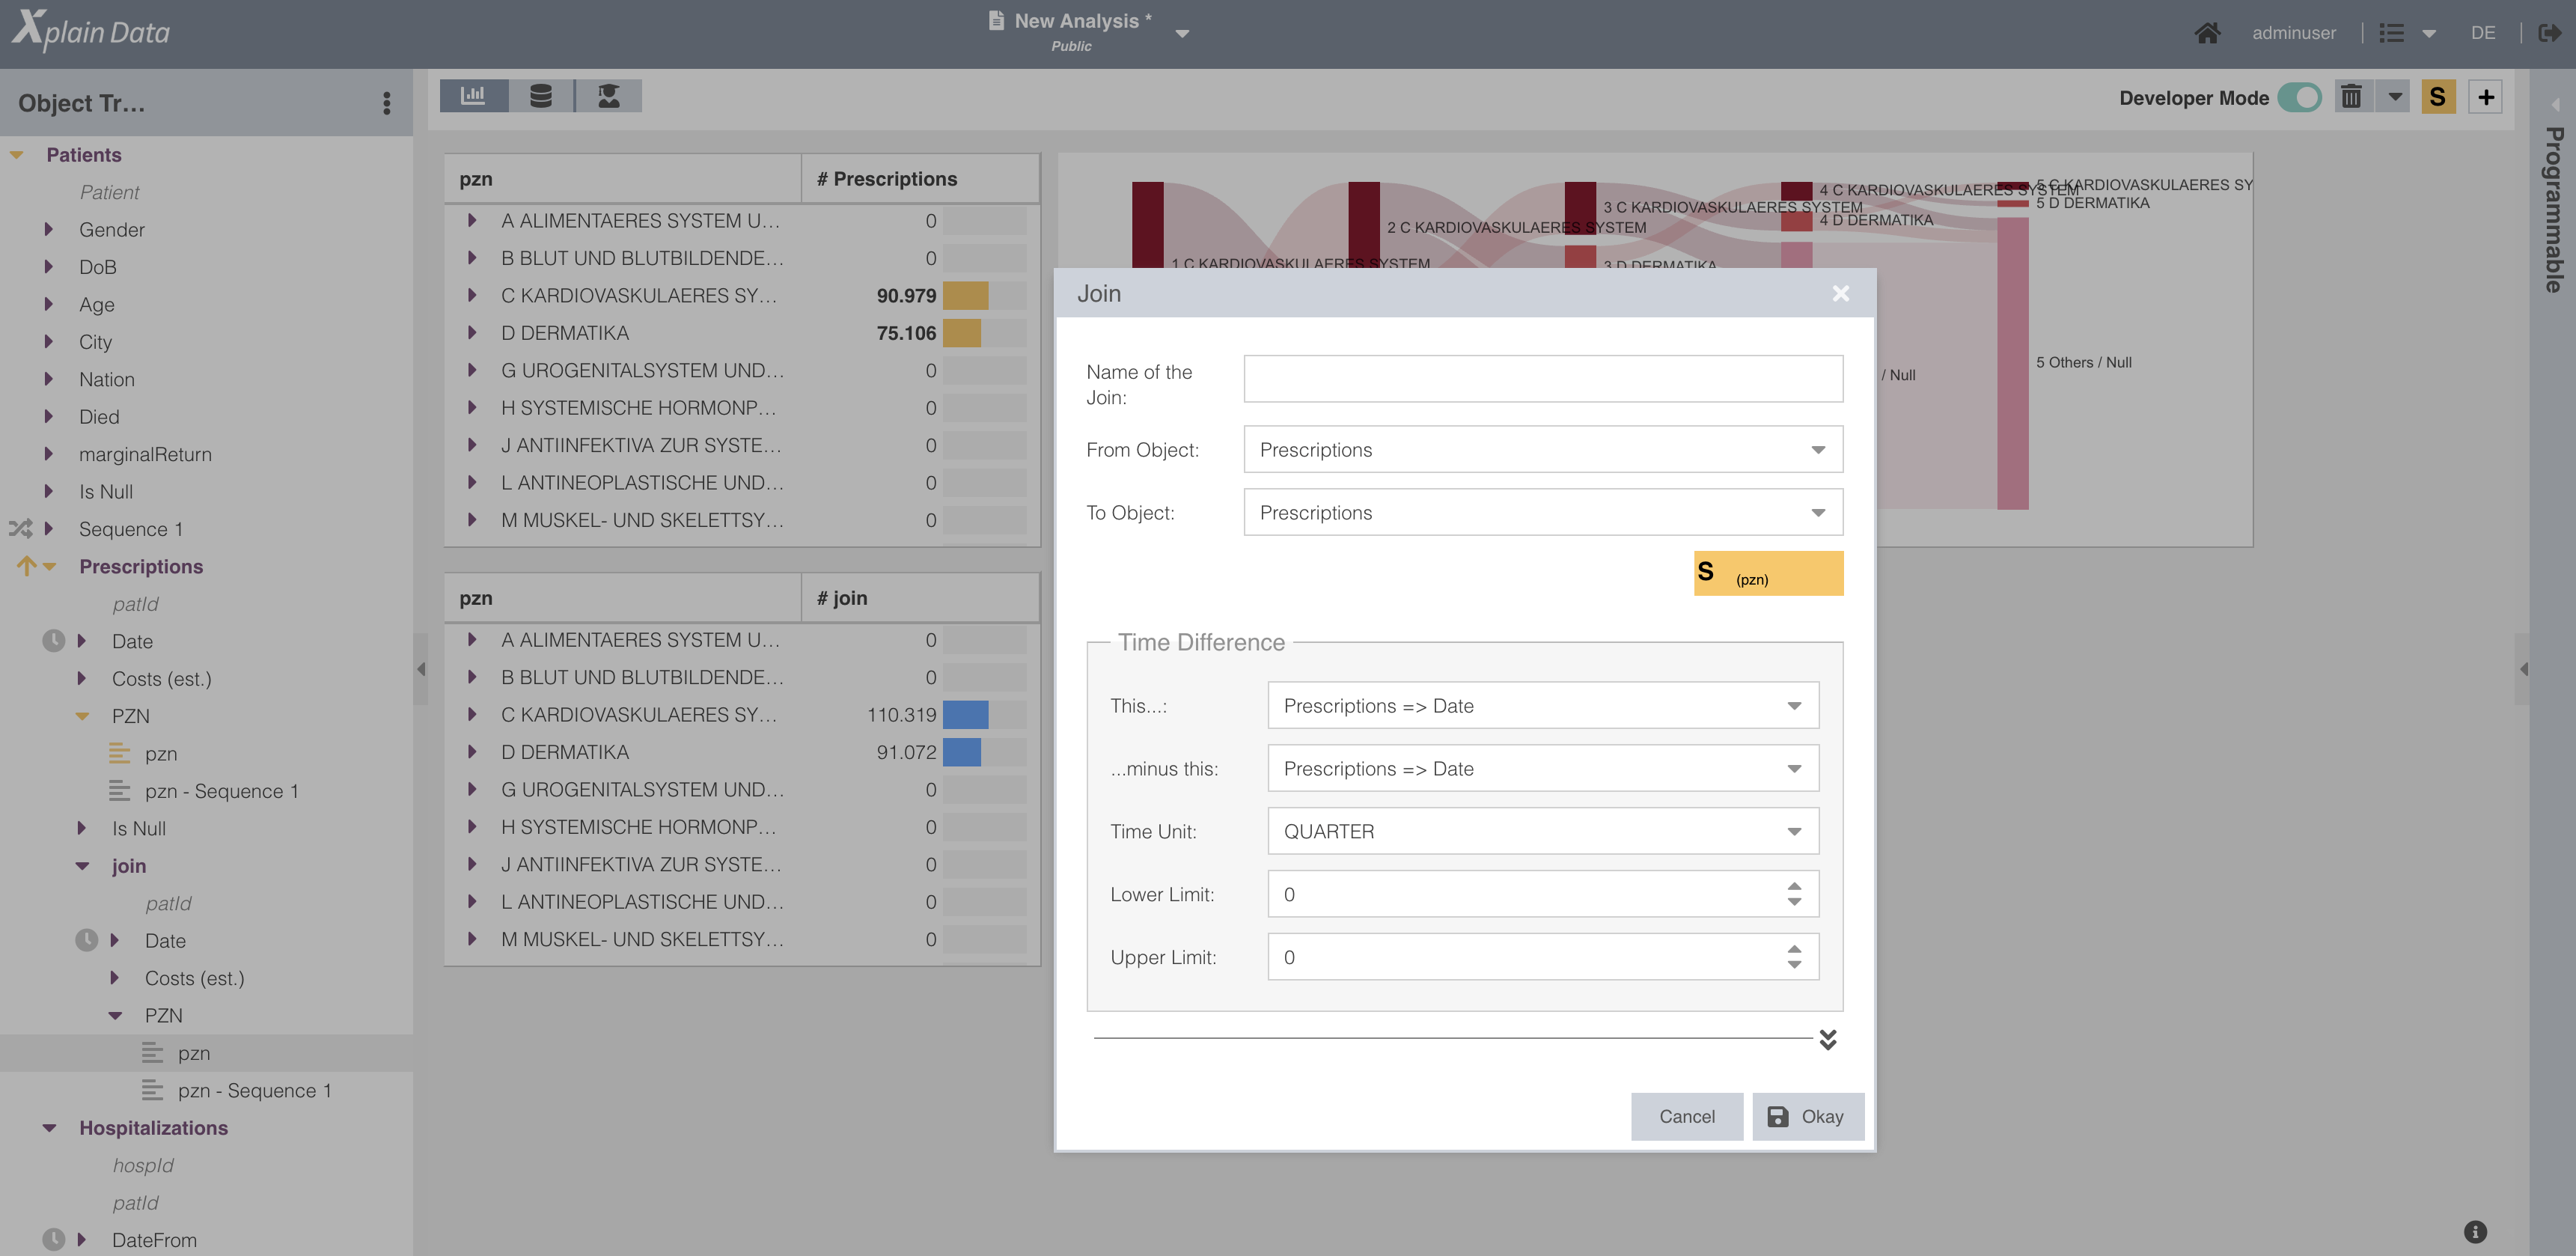
The new join method introduces database-style join operations into the ObjectAnalytics framework. A join will append another sub-object to an already existing object in focus and can easily be defined with only a couple of clicks directly in the XOE.
Note that this new feature enables you to update and adjust the structure of your object-tree on the fly!
With this method, you can:
Transfer related records (object instances) from one sub-object to another, even across sibling objects or branches. This makes it even easier to connect all relevant data for your object in focus.
Perform intra-object joins (or self-joins) within the same root or common ancestor.
Extend analysis across previously siloed data segments by joining related sub-objects.
For example, for the object “Diagnoses” you may
join all Prescriptions of a certain kind, which have been prescribed after the diagnosis was made, to the “Diagnoses” object.
join all Diagnoses of a certain kind, which have been made in the same quarter, to the “Diagnoses” object.
Since our ObjectAnalytics related tools such as the relative time axis and sequence analysis are natively applicable to the newly created objects, this method unlocks even more of the potential to efficiently search for cause-and-effect relationships in complex real-world data!
XNotebook: Interactive Script Development
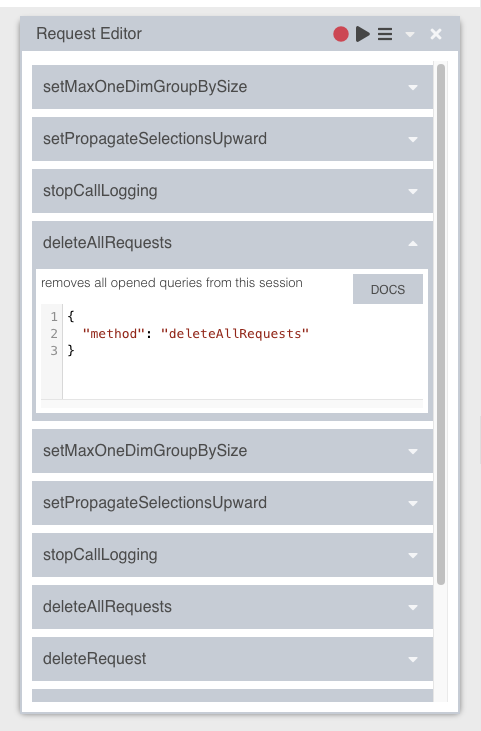
The new XNotebook provides an intuitive interface for generating, editing, and executing Xplain Data scripts. Unlike traditional script execution, XNotebook enables:
Step-by-step execution: Run commands one at a time to observe their effects.
Out-of-order execution: Explore logic paths without linear constraints.
Future integration: XNotebook will eventually replace the current Scripts menu, providing a unified scripting environment.
This feature is ideal for interactive analysis, debugging, and educational walkthroughs of script-based workflows.
Solution Builder: Script-Driven User Interaction
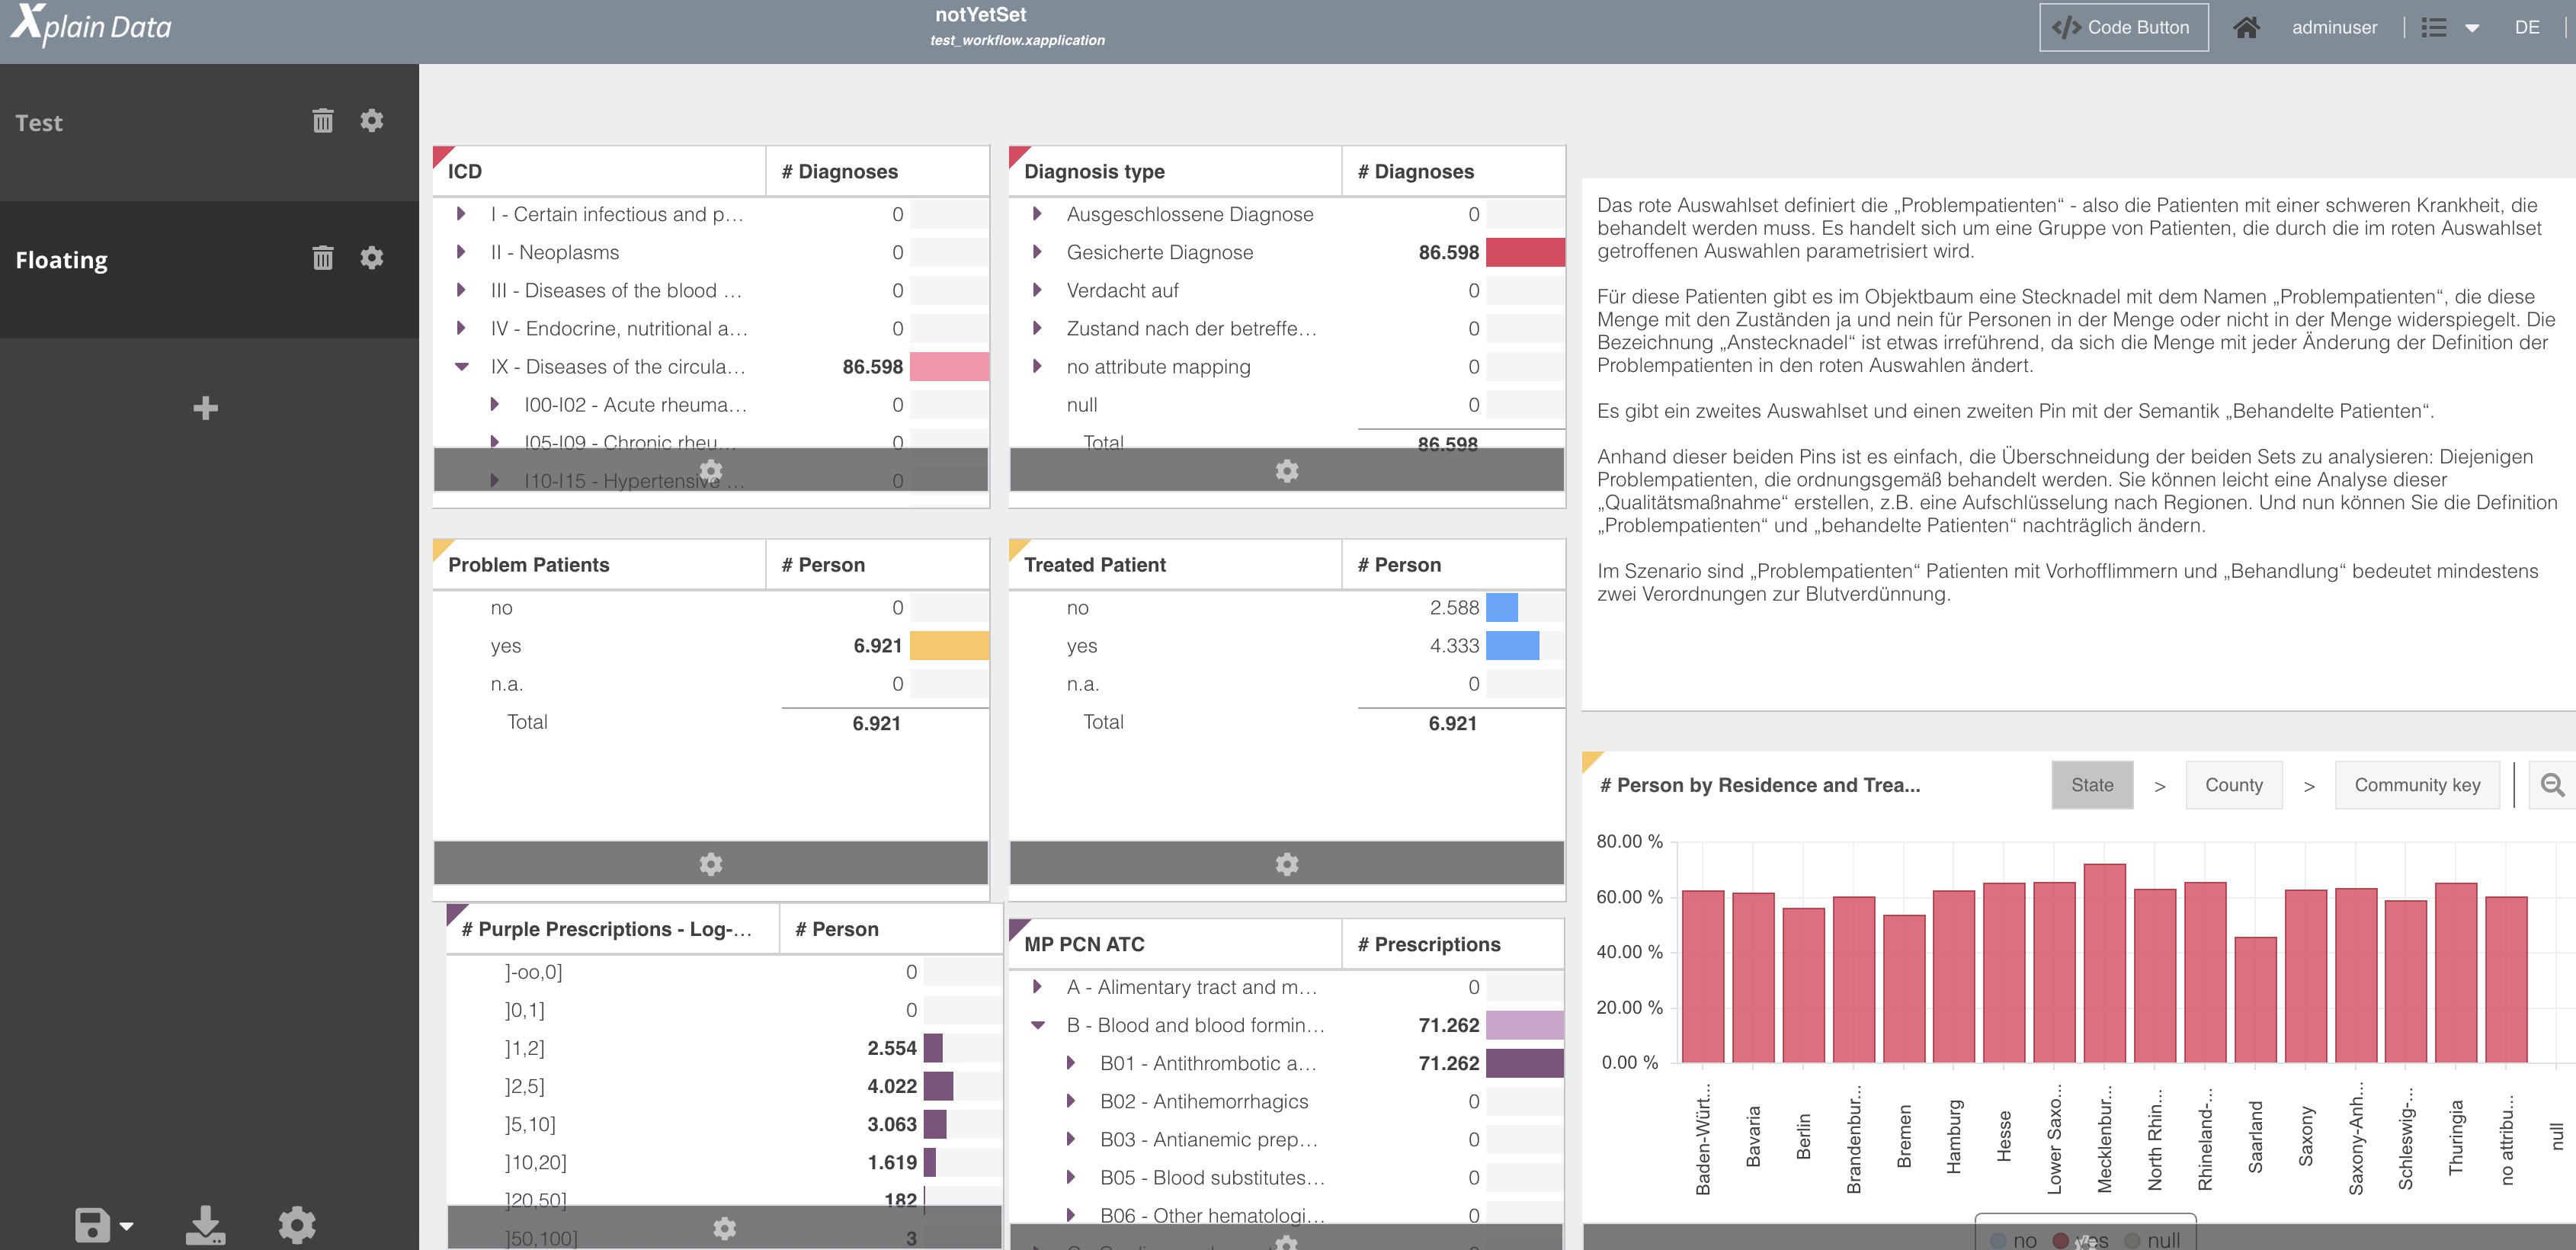
With the latest enhancements to the Solution Builder, users can now assign Xplain Data or Python scripts to:
Custom-inserted buttons
Predefined buttons in the left-hand area
This allows dynamic behaviors to be triggered with a simple click, enabling the creation of interactive, user-driven solutions that seamlessly integrate logic execution with UI elements.
These features in version 2.7.0 further enhance Xplain Data’s power for interactive development, causal analysis, and cross-structure exploration—supporting users in building more dynamic and insightful causal analytical workflows.
2.4.0 Main New Feature: Floating Pin
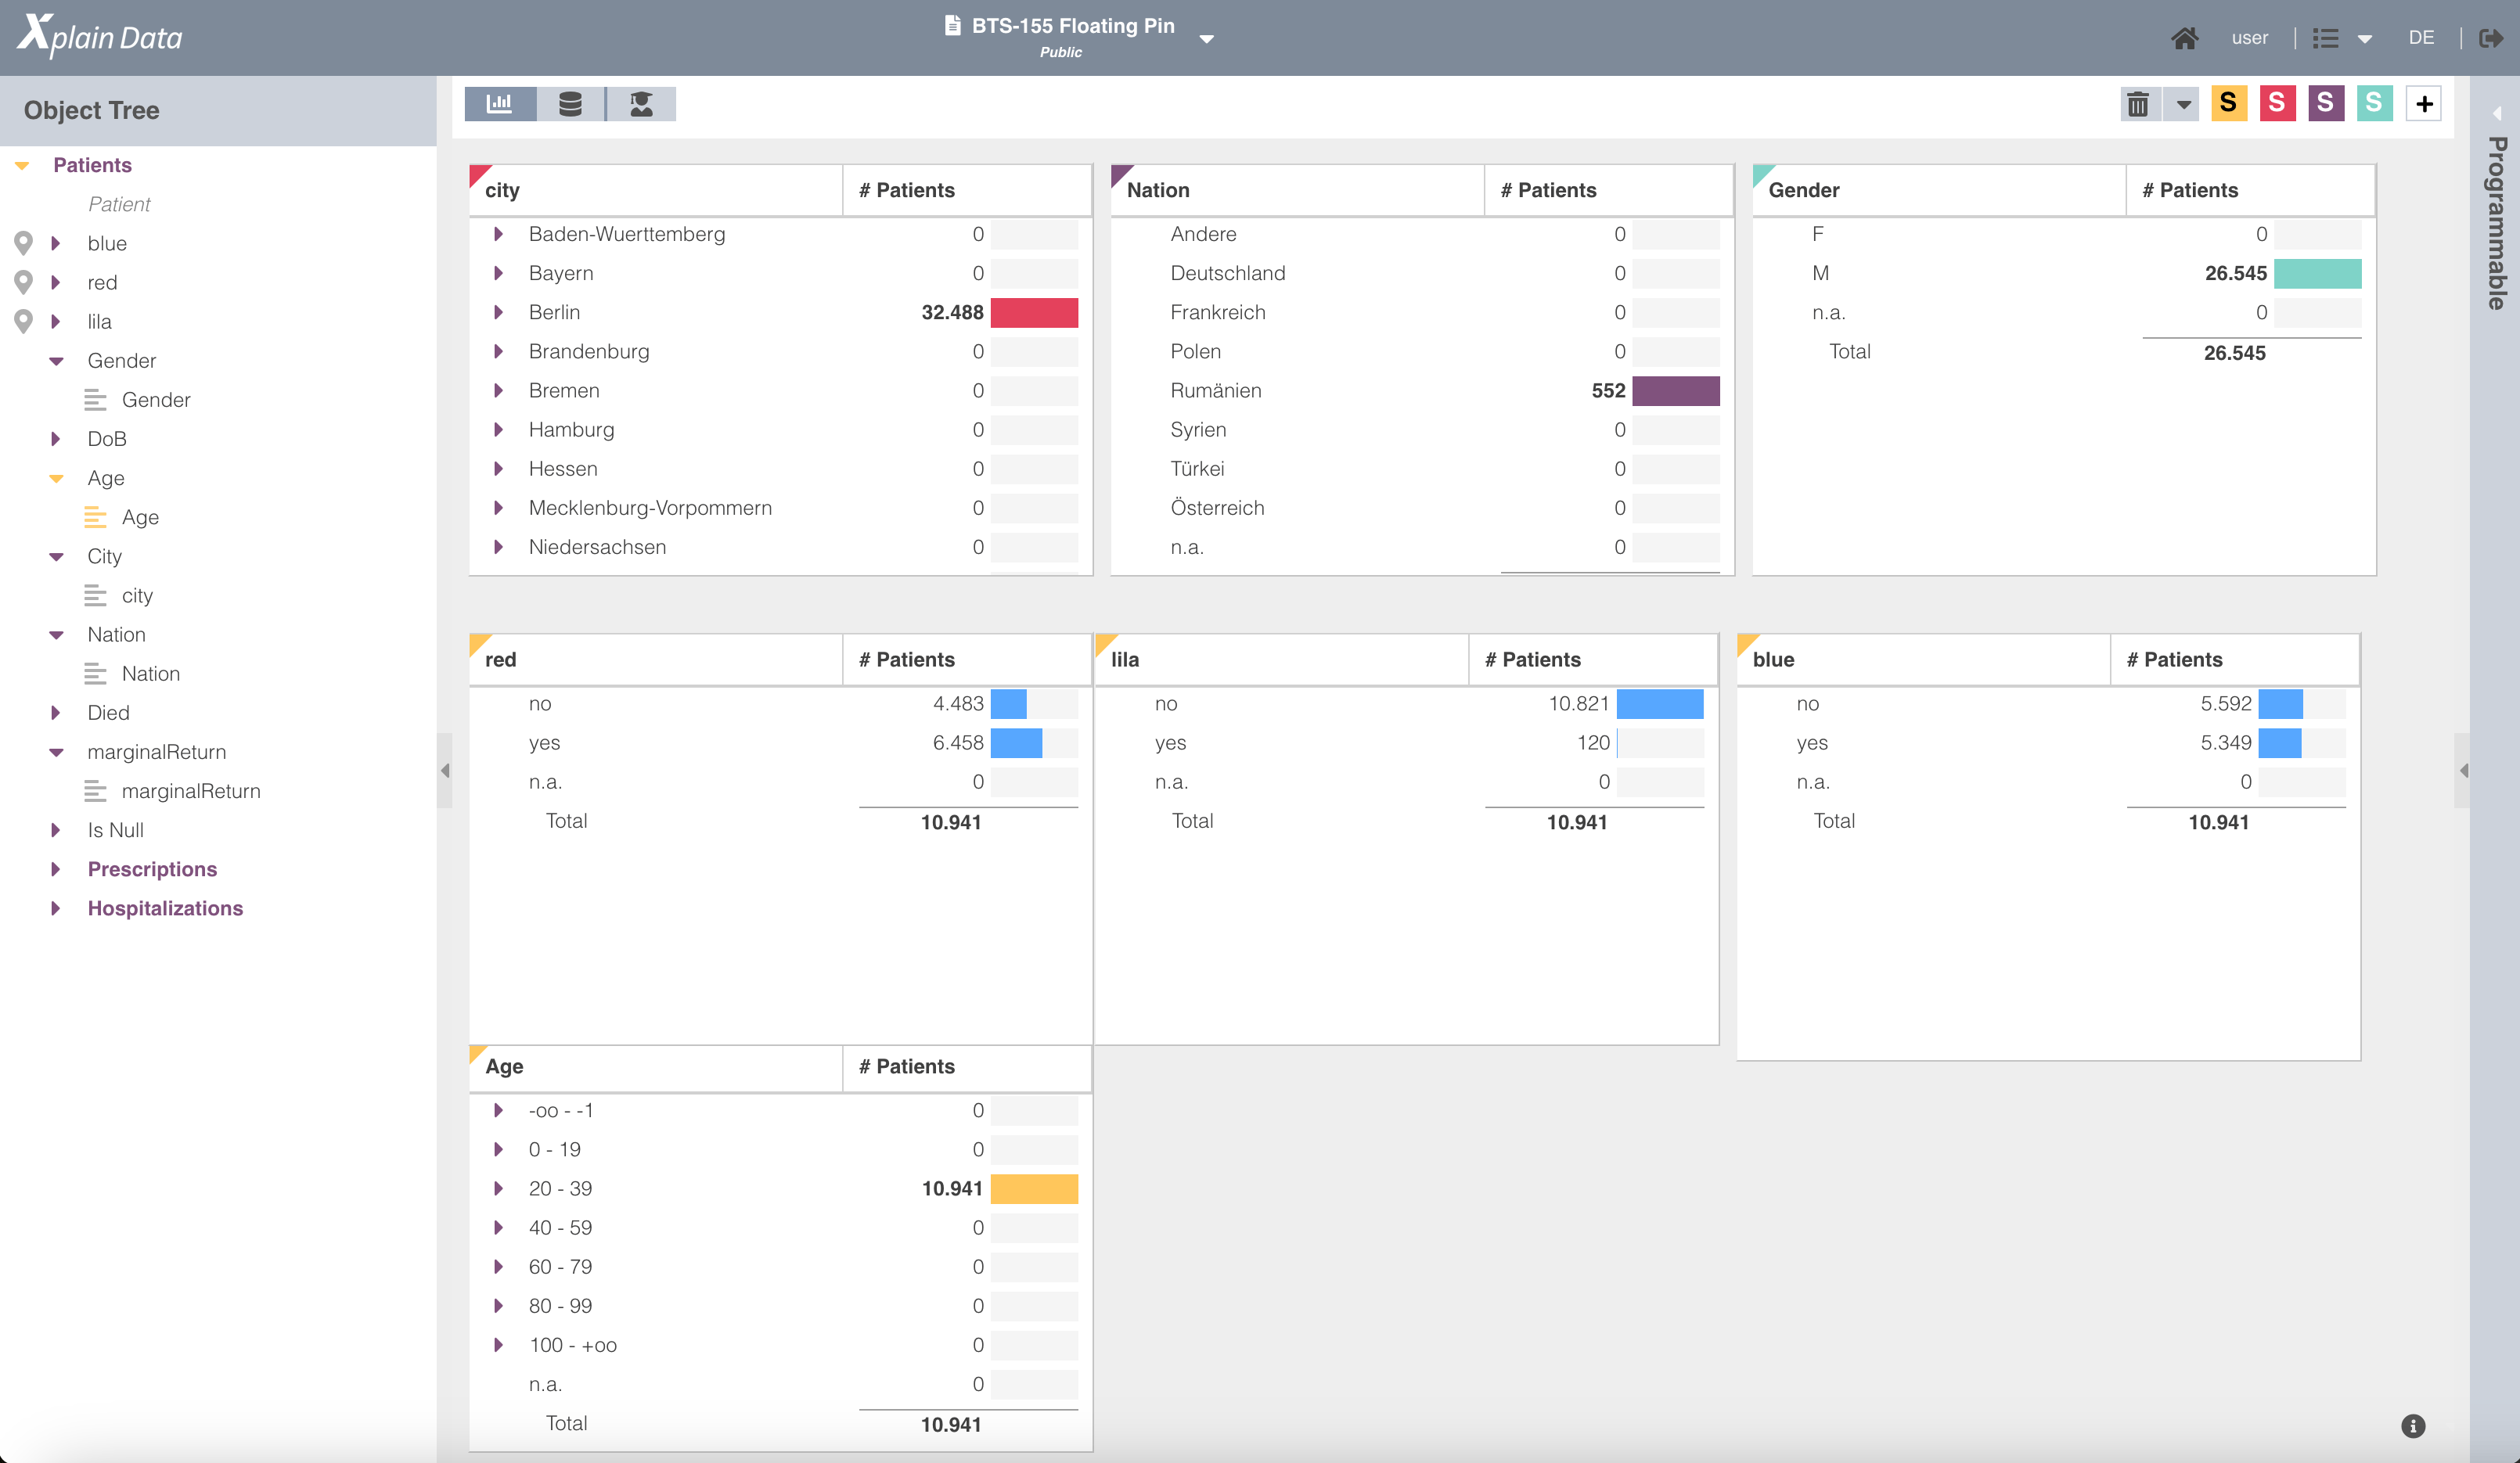
The Floating Pin feature introduces a new dimension to dynamic data analysis by allowing you to “pin” a selected segment of objects or categories, like “customers” or “patients,” to a new binary dimension. This creates a binary attribute where the currently selected objects are assigned to one of two states. This feature is especially useful for set operations, enabling actions such as selecting objects not in a segment or identifying overlaps between segments.
The floating pin leverages the current global selection of the objects to which it is applied. These selections can apply to aggregation dimensions with floating semantics. When set, the aggregation dimension dynamically adjusts based on the selected set, updating its “where” clause with the new selection. This functionality supports a concept known as the floating pin, which updates automatically with any changes to the corresponding selection set.
Advantages of Using Floating Pins for Causal Discovery
Dynamic Analysis: - The floating pin enables real-time updates to the selection set, facilitating dynamic exploration of causal relationships as data or selections change.
Enhanced Flexibility: - By adjusting to selection set changes, the floating pin aids in identifying causal patterns across varied subsets of data, offering greater analytical flexibility.
Streamlined Set Operations: - Creating floating pins supports complex set operations like intersection and exclusion, critical for isolating and understanding causal factors.
Improved Accuracy: - The floating pin ensures that the aggregation dimension reflects the latest selection set, resulting in more precise and relevant causal inferences.
Efficient Hypothesis Testing: - Researchers can easily modify the selection set and observe the impact on causal relationships, streamlining hypothesis testing across scenarios.
Scalable Insights: - As datasets or selection criteria evolve, the floating pin adapts, simplifying the process of deriving insights from large, dynamic datasets.
With the Floating Pin feature, users can conduct in-depth causal analyses with enhanced flexibility and accuracy, making it a valuable tool for modern data exploration and hypothesis testing.
2.3.0 Causal Pathways (Temporal Causal Graphs) and Floating Semantics Relative Timeline
Release Date: 01 August 2024
Main New Feature (Beta Version)
Causal Pathways (Temporal Causal Graphs)
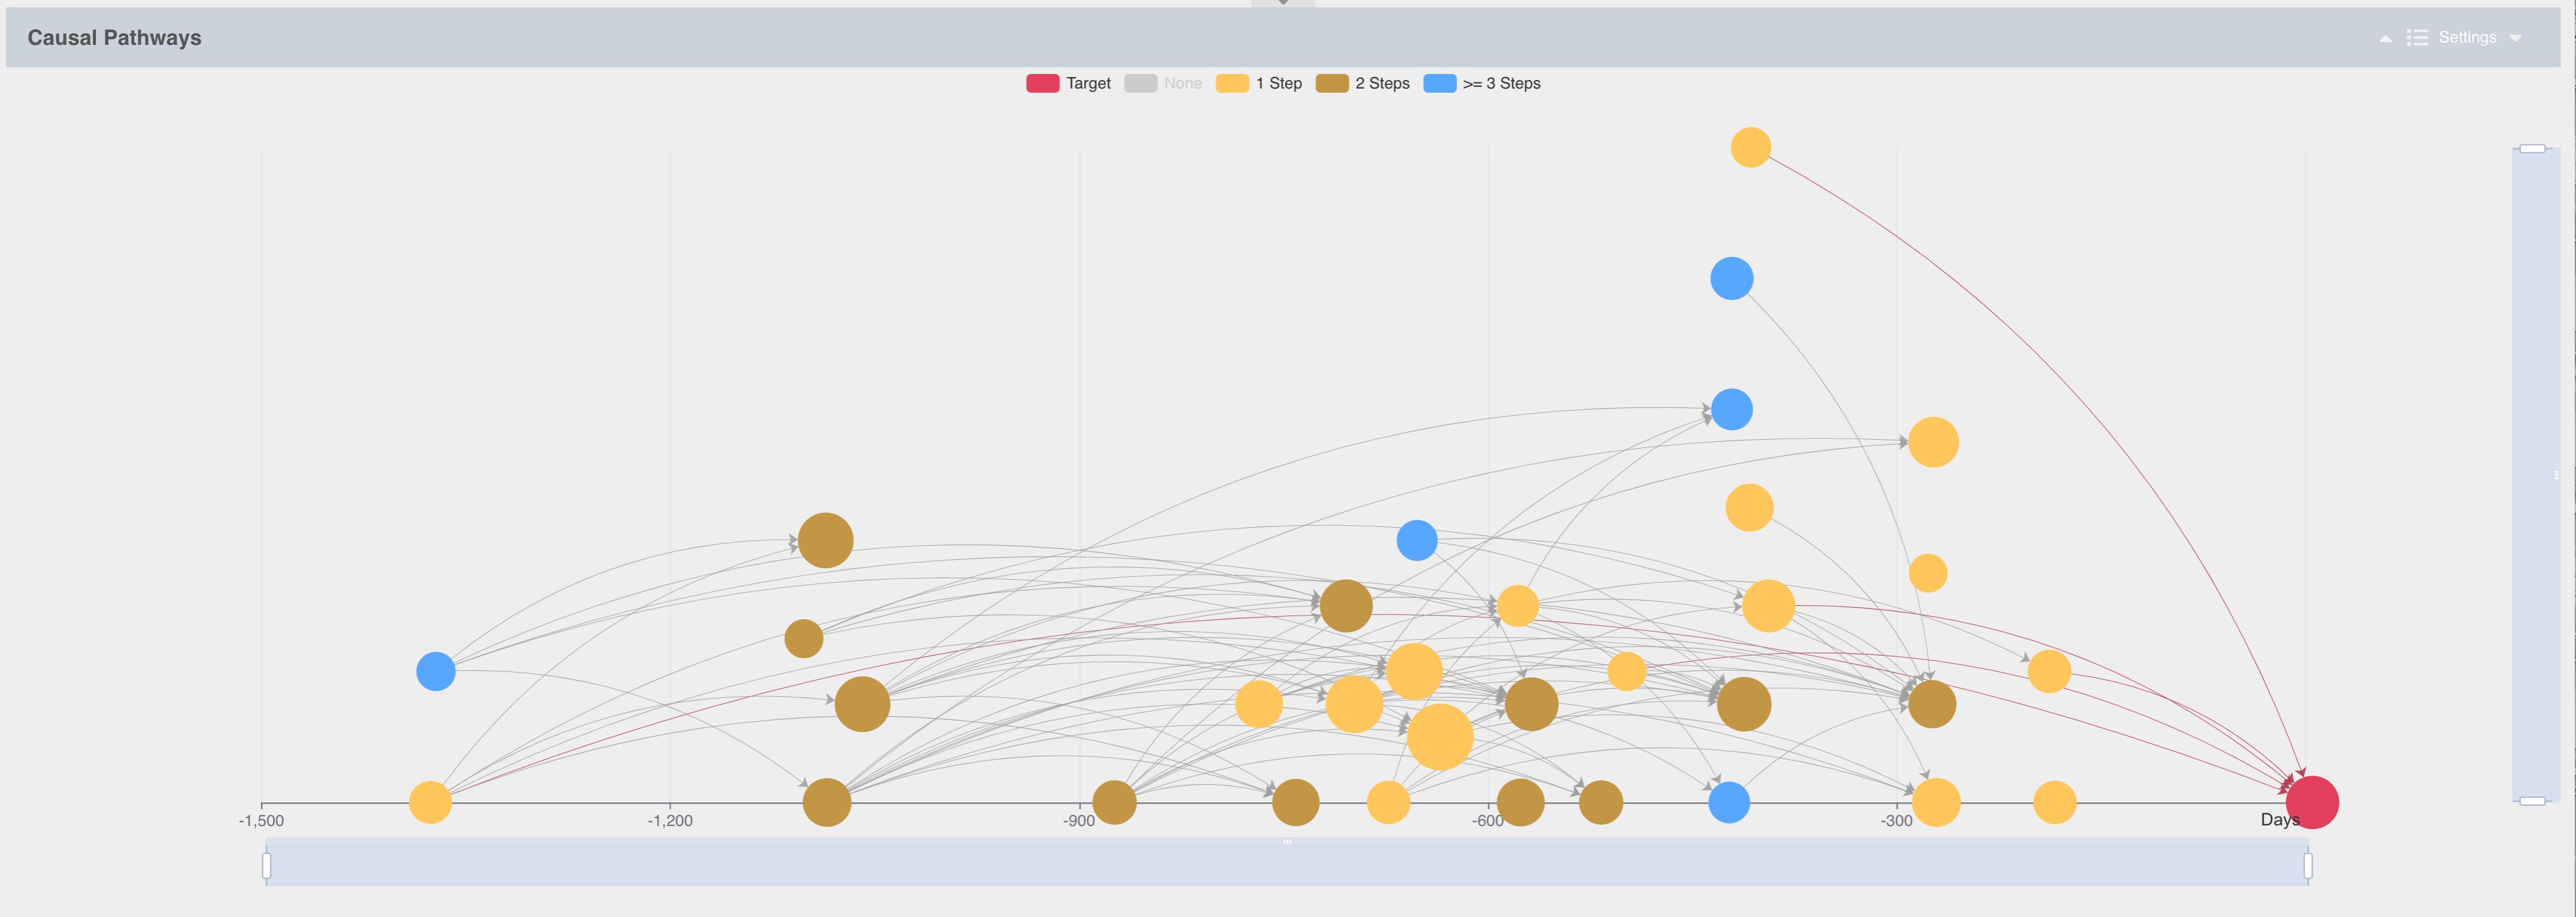
We are excited to introduce our new Causal Pathways feature, offering a graphical and interactive representation of both direct and indirect causal factors that influence a target variable over time. This feature leverages time-sensitive data, meaning that the effect must follow the cause, as per Xplain Data Causal Discovery algorithms. Data stored within sub-objects of an ObjectAnalytics model are typically event sequences with timestamps (e.g., patient diagnoses or manufacturing measurements).
The interactive graph is linked with a tabular presentation for each factor, displaying key details such as direct and total effects and time to target. Additional features allow zooming into specific graph segments, helping users focus on particular nodes.
This beta version will evolve over subsequent releases, though we currently do not guarantee backward compatibility.
Key Highlights:
Visual Representation of Temporal Causal Relationships: Enables users to identify and understand both direct and indirect causal pathways between variables.
Relative Time Axis Causal Discovery: Facilitates the identification of causal relationships over time.
Analysis of Total Effect and Direct Effect: Provides insights into the overall and direct impact of variables.
Examination of Levels of Indirect Effect: Allows for analysis of intermediate pathways connecting variables.
Enhanced Decision-Making: Enables informed decisions by clarifying variable interdependencies.
Seamless Integration: Integrates with existing causal discovery workflows to enhance user experience.
Note: Below is an example representation of a Causal Pathways (or Temporal Causal Graph), depicting time progression from left to right.
Main Bug Fixes
Adjusted Floating Semantics Relative Timeline
We have resolved a significant issue with the floating semantics relative timeline to improve accuracy and reliability:
Accurate Handling of Parent Object Selections: Ensures correct application of selections from parent objects within the relative timeline.
Exclusion of Upward Dimension Selections: Prevents selections propagated from upward dimensions from being included.
Removal of Implicitly Dependent Selections: Eliminates selections that rely on the relative timeline itself, resulting in improved data accuracy.
Improvements:
Improved Data Integrity: Enhances timeline reliability and accuracy by resolving dependencies.
Refined Selection Management: Ensures precise handling of parent object selections and exclusion of unnecessary dimensions.
We appreciate your continued support and valuable feedback. If you have any questions or require further assistance, please feel free to contact our support team.