4. XOE Python integration
Xplain Data offers a suite of Python integration designed to seamlessly integrate with the Xplain backend engine, empowering developers and data scientists to harness the full potential of their data. These services include:
Python programming panel
Experience the power of a robust Integrated Development Environment (IDE) tailored for Python development. The Python IDE provided by Xplain Data includes features such as:
Syntax Highlighting: Easily read and write Python code with color-coded syntax.
Live python App using pyodide: Without installing python environment you can run python code directly in Object Analytics: either in embedded python IDE or in JupyterLite.
Serverside python: In this case the Pyhon Interpreter environment is installed on the server side where the Xplain Object Analytics Engine is running.
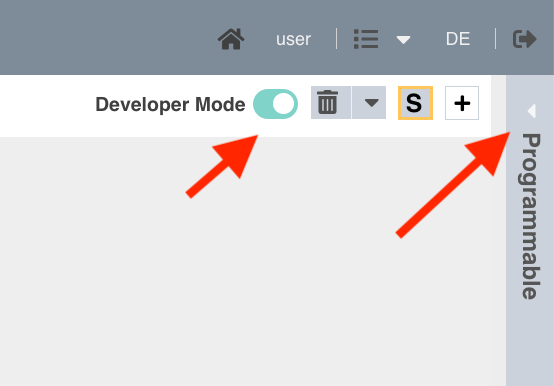
To enable Python programming panel
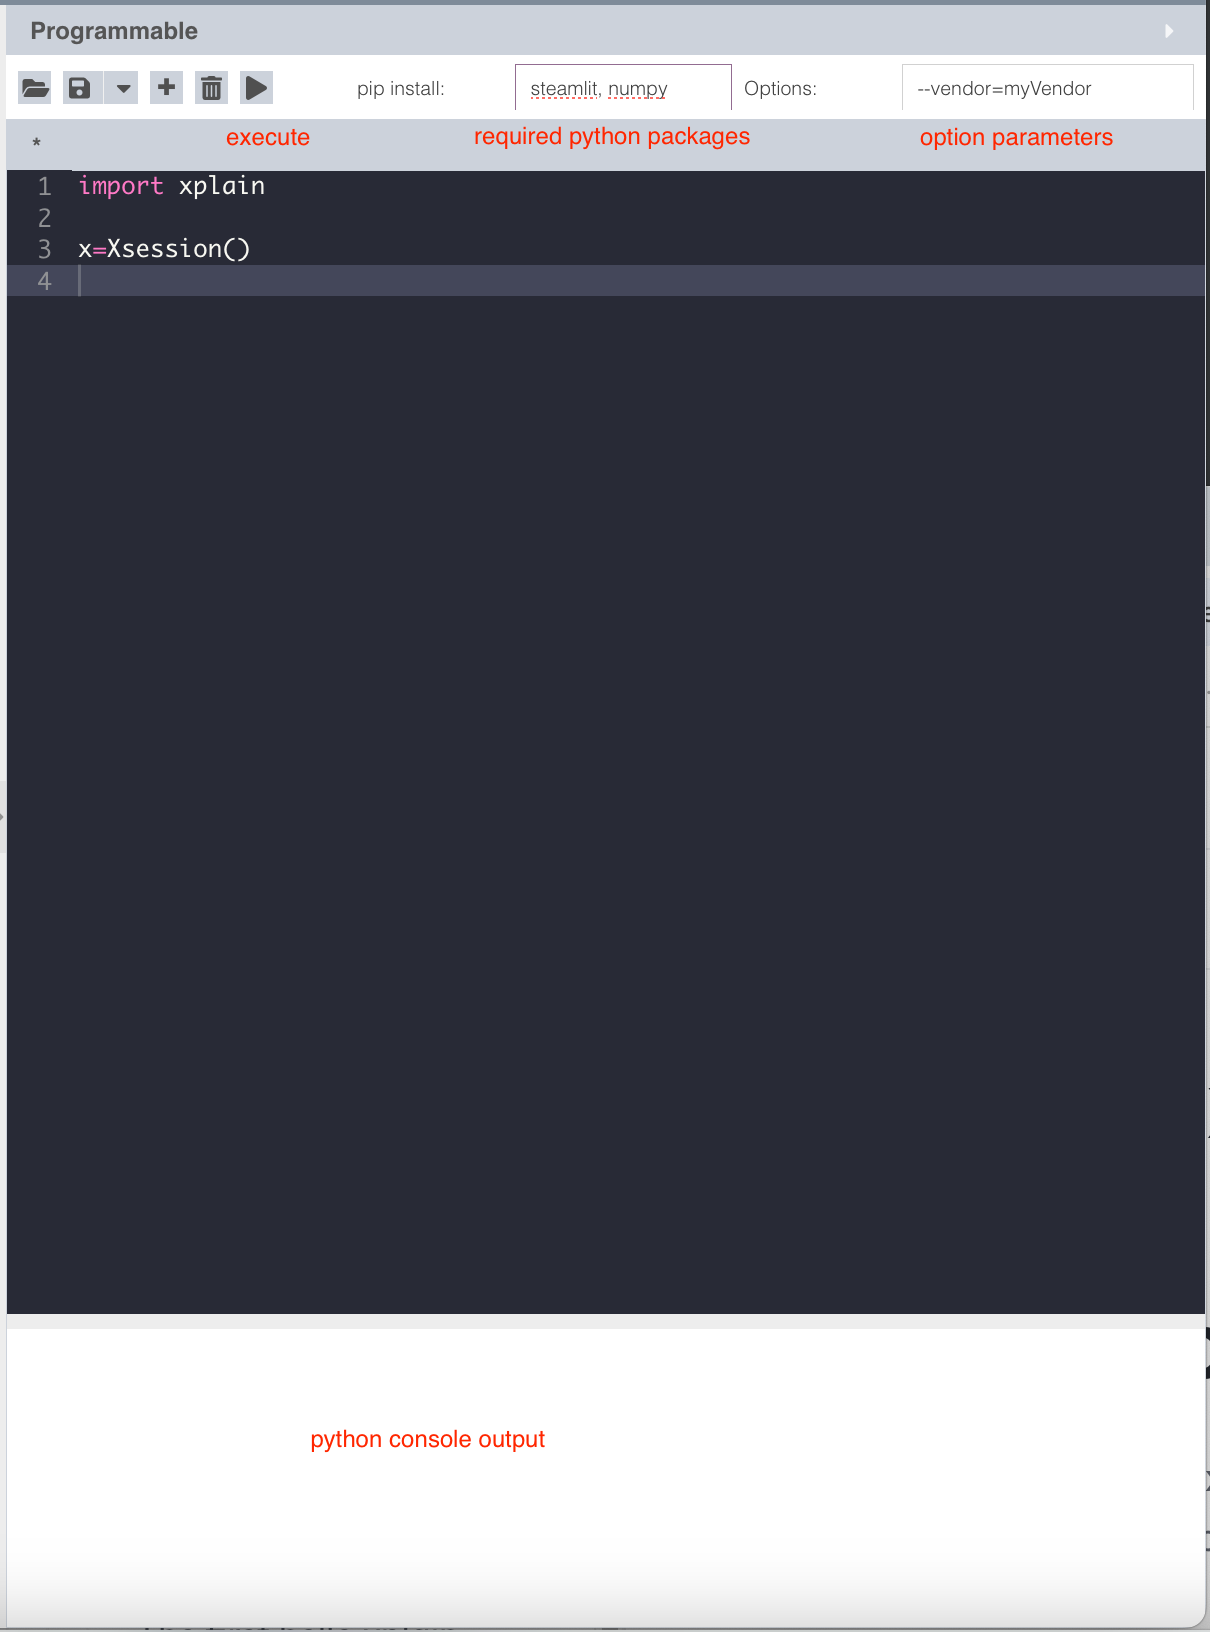
Python programming panel layout
Jupyterlite
Leverage the lightweight, web-based version of Jupyter for interactive computing. JupyterLite provides: By utilizing these comprehensive Python services, Xplain Data enables you to streamline your data workflows, enhance your analytical capabilities, identify the causal relationship using causal API. With our python services, you can not only achieve these goals using our Xplain xoe directly, but also build powerful causal AI and data analytics applications with ease.
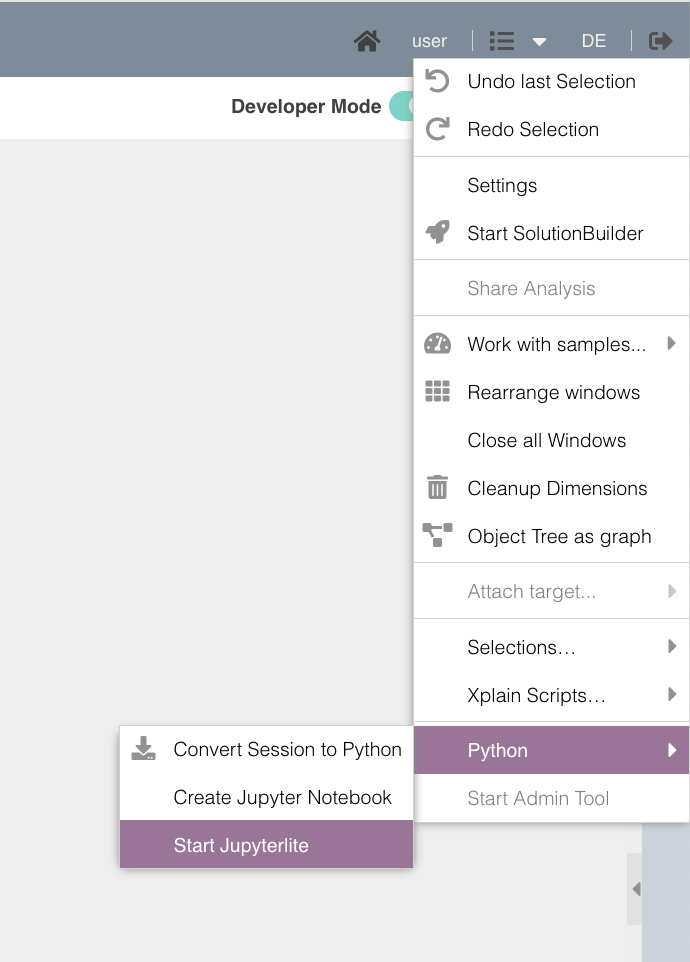
start jupyterlite from XOE
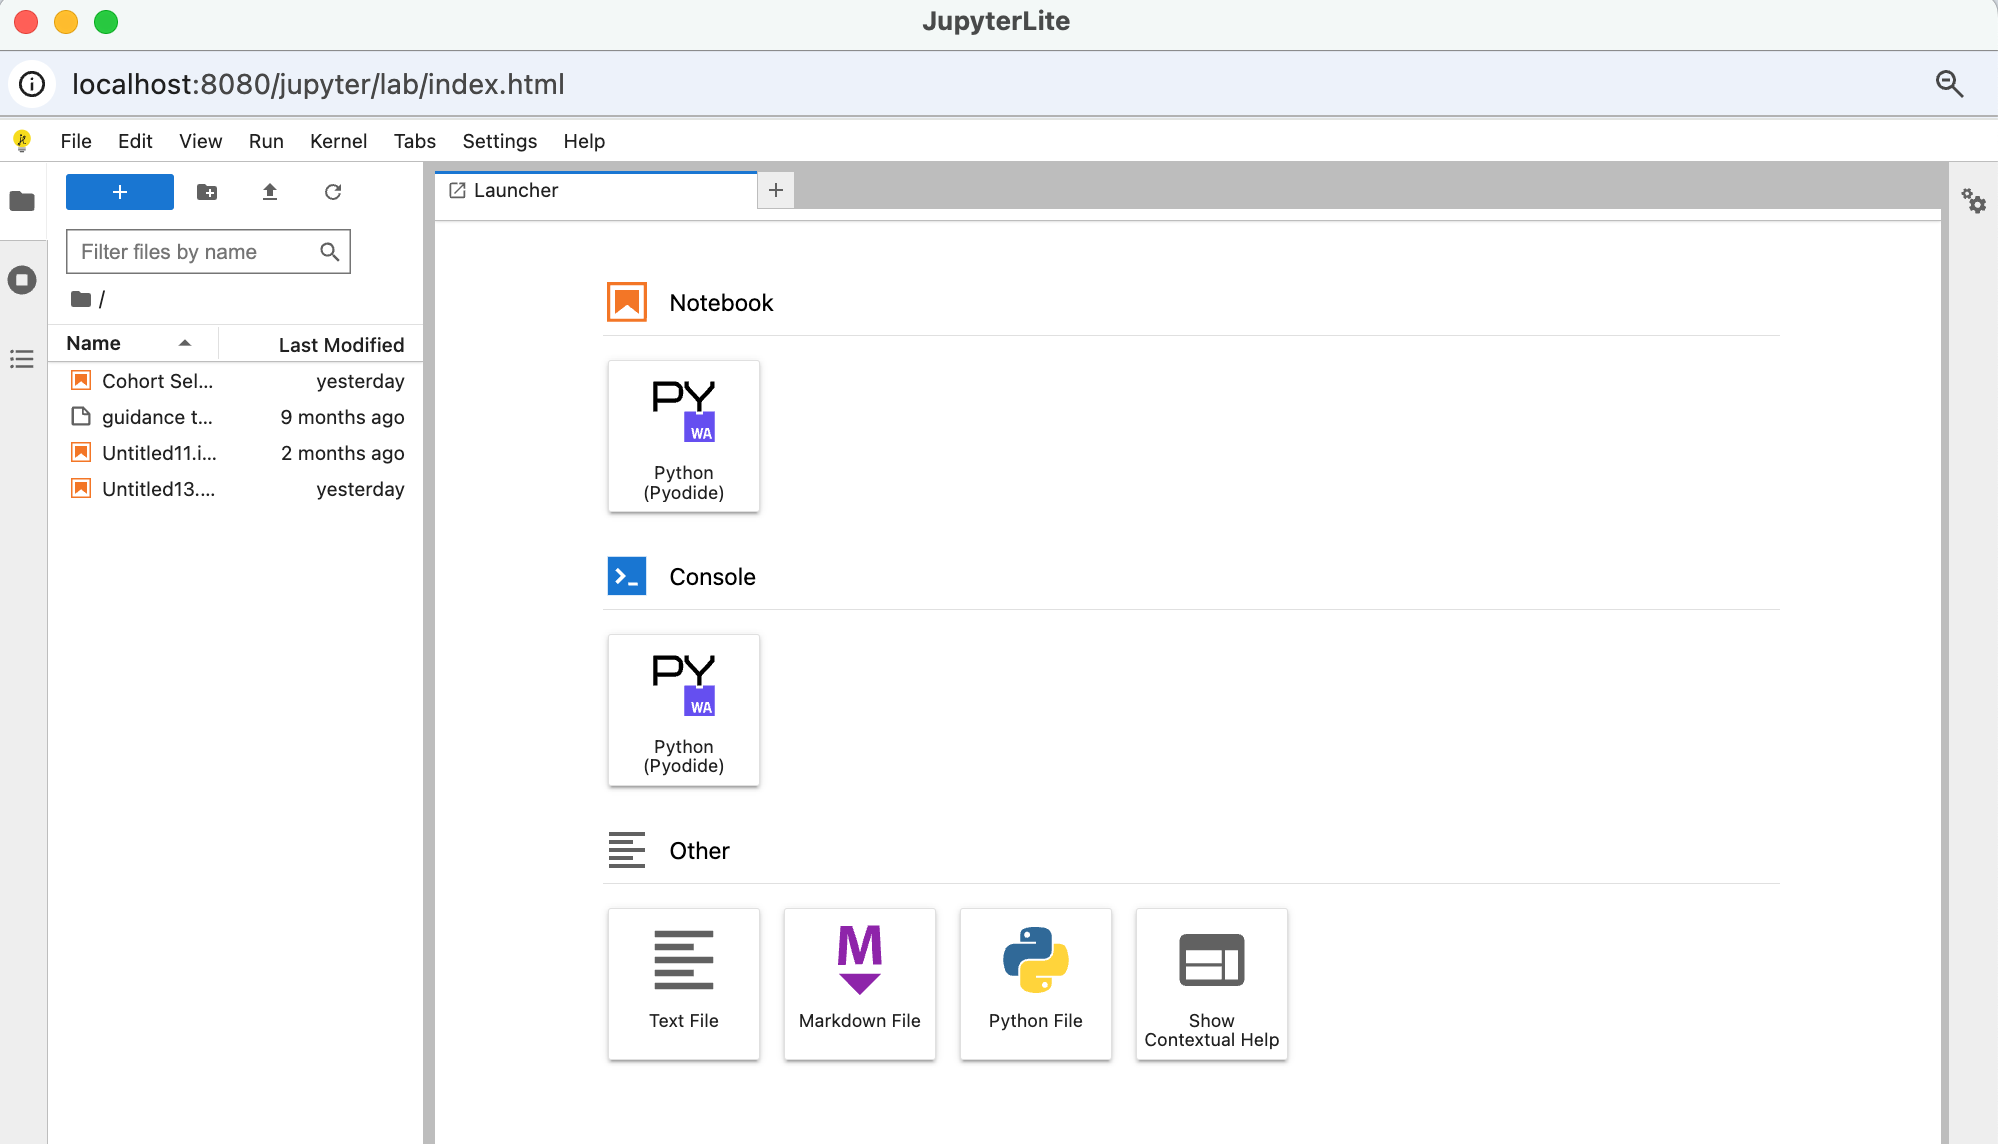
start notebook from juptyerlite –> please chose ´´Notebook´´
Since JupyterLite is running in the web assembly, the required packages can not be persisted locally, they need to by installed on-demand on each session.
With the preinstalled package piplite you can add the additional packages with ´´await piplite.install(<package_name)´´
Example: import xplain package in jupyterlite notebook
import piplite
await piplite.install("xplain")
import xplain
Basics of xplain PyPi package to get started
The xplain PyPi package is a Python package that provides a Python interface to the Xplain Data backend engine. With the xplain package, you can easily interact with the Xplain Data backend engine, run queries, and retrieve data. The xplain package is available on PyPi and can be installed using pip.
Xsession()
login to an Object Analytics Instance and init a Xsession instance
import xplain

# replace url with your currentObject Analytics host
x=xplain.Xsession(url="https://xoebp.xplain-data.com",user="me",password="secret1")

# or if you're running your XOE on your local host,
#just use:
#x=xplain.Xsession()
Xsession.startup(file_name):
load a XView (xstartup) file to setup a new xplain session
import xplain

s = xplain.Xsession(url="http://myhost:8080", user="me",
password="secret1")
s.startup(file_name="myXview")
Xsession.execute_query()
execute a query
import xplain

s = xplain.Xsession()
query = {
    "requestName": "myRequest",
    "aggregations" :[
        {
           "object": "AU-Diagnosen",
           "dimension": "Diagnose",
           "type": "SUM"
       }
    ],
    "groupBys":[{
       "attribute": {
           "object": "Hospital Diagnose",
           "dimension": "Diagnose",
           "attribute": "Type"
       }]
    }
}
df = s.execute_query(query)
Xsession.open_query()
open a query
import xplain

s = xplain.Xsession()
query = {
    "requestName": "myRequest",
    "aggregations" :[
        {
           "object": "AU-Diagnosen",
           "dimension": "Diagnose",
           "type": "SUM"
       }
    ],
    "groupBys":[{
       "attribute": {
           "object": "Hospital Diagnose",
           "dimension": "Diagnose",
           "attribute": "Type"
       }]
    }
}
df = s.open_query(query)
Xsession.run():
To run a xplain method perform xplain web api method and broadcast the change to other client sharing with same session id, if Python session is sharing the same session with Object Analytics, Object Analytics will be get updated.
import xplain

x = xplain.Xsession()
x.run({"method":"clearAllSelections"})
References
Python Xplain package see xplainpy-reference-label
Web api see xplain-web-api-label
Additional Examples
interact with Object Analytics
the python package xplain will be installed in pyodide by default, hence you don’t need to enter xplain in the input field pip install for following code example.
'''
This example is based on the Demo instance
https://xoebp.xplain-data.com/objectexplorer/index.html
'''
import xplain

# replace url with your currentObject Analytics host
x=xplain.Xsession(url="https://xoebp.xplain-data.com")

# or if you're running your XOE on your local host,
#just use:
#x=xplain.Xsession()

x.open_attribute(object_name="PurchaseDocument",
dimension_name="Vendor",
attribute_name="Vendor")
Using option parameters
In Web Assembly environment, the options values can be accessed inside python code via the global dict args. For example you have defined following options with specified value: --vendor=vendor_0000

'''
This example is based on the Demo instance
https://xoebp.xplain-data.com/objectexplorer/index.html
'''
import xplain

# replace url with your currentObject Analytics host
x=xplain.Xsession(url="https://xoebp.xplain-data.com")

# or if you're running your XOE on your local host,
#just use:
#x=xplain.Xsession()

vendor_parameter = args.get('vendor')


x.open_attribute(object_name="PurchaseDocument",
dimension_name="Vendor",
attribute_name="Vendor")


x.run({
 "method": "select",
 "selection": {
     "attribute" : {
         "object" : "PurchaseDocument",
         "dimension" : "Vendor",
         "attribute" : "Vendor" },
     "selectedStates" : [vendor_parameter]
    }
})
Build a mini data app with streamlite package
import streamlit as st
import xplain
import plotly.express as px

x = xplain.Xsession(url="https://xoebp.xplain-data.com")
    "method": "deleteRequest",
    "requestName": "test"
    })

df = x.open_attribute( object_name="PurchaseDocument",
                       dimension_name="SpendArea",
                       attribute_name="SpendArea",
                       request_name="test")

fig = px.bar(df, x='SpendArea', y='# PurchaseDocument')
st.title="This is a minimal streamlit app powered by Xplain Data"

st.plotly_chart(fig)

if st.button('Say hello'):
    st.write('hello world!')
Build data app with advanced plotting packages
add plotly, scipy, streamlit to pip install input field
import streamlit as st
import numpy as np
import plotly.figure_factory as ff
import plotly.express as px
import plotly.graph_objects as go


np.random.seed(1)
N=70

st.set_page_config(
    page_title="Hello",
    page_icon="👋",
)

st.write("# Welcome to Xplain App with chart! 👋")

# Add histogram data
x1 = np.random.randn(200) - 2
x2 = np.random.randn(200)
x3 = np.random.randn(200) + 2

# Group data together
hist_data = [x1, x2, x3]

group_labels = ['Group 1', 'Group 2', 'Group 3']

# Create distplot with custom bin_size
fig = ff.create_distplot(
    hist_data, group_labels, bin_size=[.1, .25, .5])

# Plot!
st.plotly_chart(fig, use_container_width=True)

df = px.data.tips()

st.write(df)

fig_violin = px.violin(df, y="tip", x="smoker", color="sex", box=True,
      points="all",
      hover_data=df.columns)

st.plotly_chart(fig_violin, use_container_width=False)


fig_go = go.Figure(data=[go.Mesh3d(x=(70*np.random.randn(N)),
               y=(55*np.random.randn(N)),
               z=(40*np.random.randn(N)),
               opacity=0.5,
               color='rgba(244,22,100,0.6)'
              )])

fig_go.update_layout(
    scene = dict(
    xaxis = dict(nticks=4, range=[-100,100],),
                 yaxis = dict(nticks=4, range=[-50,100],),
                 zaxis = dict(nticks=4, range=[-100,100],),),
    width=700,
    margin=dict(r=20, l=10, b=10, t=10))

st.plotly_chart(fig_go, use_container_width=True)