Render a chart with Plotly
Install a third-party plotting package and render its chart as the script output.
The Python Code panel (see IDE Features) runs in a Pyodide WebAssembly
sandbox by default, which ships only a small set of preinstalled packages. Any other
package — including plotly — must be installed first through the pip install
field, exactly like xplain itself in the hello world example.
When a script print()s a full HTML document, the output is not shown as text:
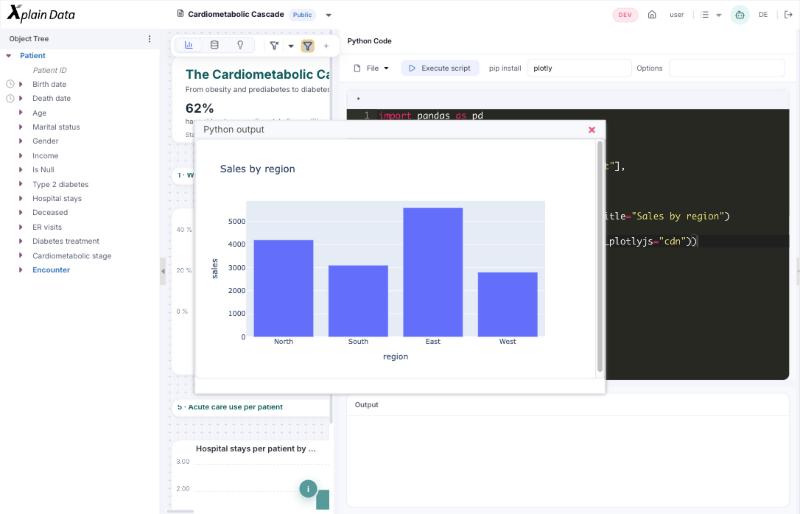
the Output panel stays empty and a separate Python output window opens instead,
rendering that HTML. This is how fig.to_html(full_html=True, ...) turns into an
interactive chart — the same mechanism would render any other HTML a package produces
(for example a Folium map or a Bokeh plot), as long as the package is installed first.
Open the Python Code panel (main menu ☰ → Tools → Python → Create Jupyter Notebook) and enter
plotlyin pip install.Enter the script in the code area:
import pandas as pd
import plotly.express as px

df = pd.DataFrame({
    "region": ["North", "South", "East", "West"],
    "sales":  [4200, 3100, 5600, 2800],
})

fig = px.bar(df, x="region", y="sales", title="Sales by region")

# full_html=True and include_plotlyjs="cdn" are required — the output window
# renders the printed text as a full HTML document, not as a plain string
print(fig.to_html(full_html=True, include_plotlyjs="cdn"))
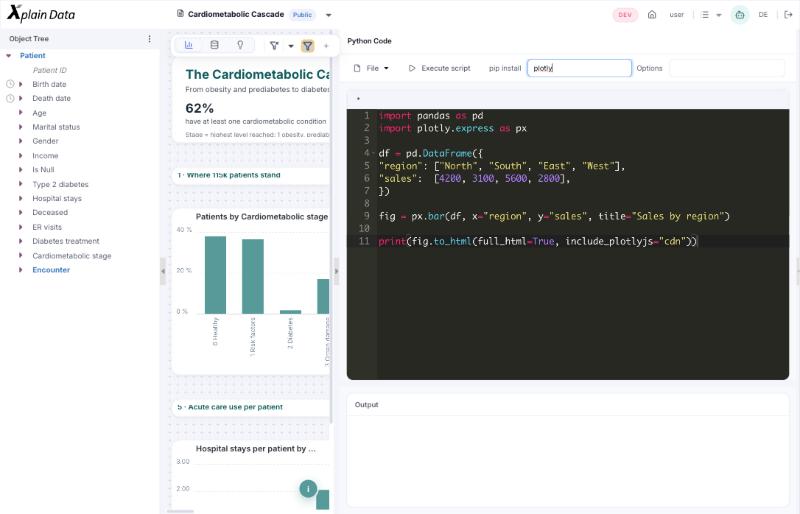
Click Execute script. A Python output window opens with the rendered, interactive chart.