Interaction with xoe
Create a chart, install python package and set the options.
The xplain session instance shall be created by the constructor method
xplain.Xsession(),the constructor shall be called without parameters likeurl, username and passwordxplain.startup() or xplain.load_from_session_id() are not necessary, the xplain session is take over from the current XOE xplain session.
Any xplain session changes made by python code will automatically reflected in XOE, and vice versa.
In Web Assembly environment, the options values can be accessed inside python code via the global dict
args. For example you have defined following options: –gender=”male”, to access this option in python code you could useargs.get("gender")
Example code for interaction with xoe:
import xplain

print(f'args: {args}')

GenderSelection = args.get('Gender')

methodCalls = [
  {
    "method": "setPropagateSelectionsUpward",
    "propagateSelectionsUpward": False
  },
  {
    "selectionSet": "globalSelections",
    "selections": [
      {
        "attribute": {
          "name": "Gender",
          "attribute": "Gender",
          "dimension": "Gender",
          "object": "Patients"
        },
        "selectedStates": [
          GenderSelection
        ]
      }
    ],
    "method": "select"
  },
  {
    "request": {
      "requestName": "openGender",
      "groupBys": [
        {
          "groupByName": "GROUP BY Gender",
          "groupByLevelNumber": 1,
          "groupByStatesFormHierarchyWithRoot": "Gender",
          "includeUpperLevels": True,
          "attribute": {
            "name": "Gender",
            "attribute": "Gender",
            "dimension": "Gender",
            "object": "Patients"
          }
        }
      ],
      "requestId": "openGender",
      "externalSelections": "globalSelections",
      "aggregations": [
        {
          "aggregationType": "COUNT",
          "aggregationName": "# Patients",
          "complementMissingBranches": False,
          "type": "COUNT",
          "object": "Patients"
        }
      ]
    },
    "method": "openQuery"
  }
]


x = xplain.Xsession()

x.run({ "method": "executeBatch", "methodCalls": methodCalls})
Enable Developer mode if needed (main menu ☰ → Settings → Developer mode).
Open the main menu (☰) → Tools → Python → Create Jupyter Notebook.
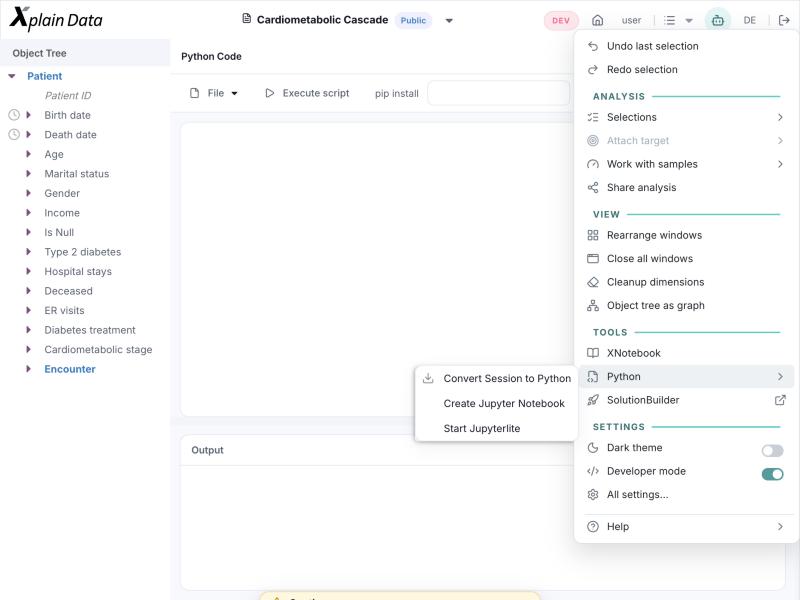
In the Python Code panel, open File → New script and copy the above code example into the code area.
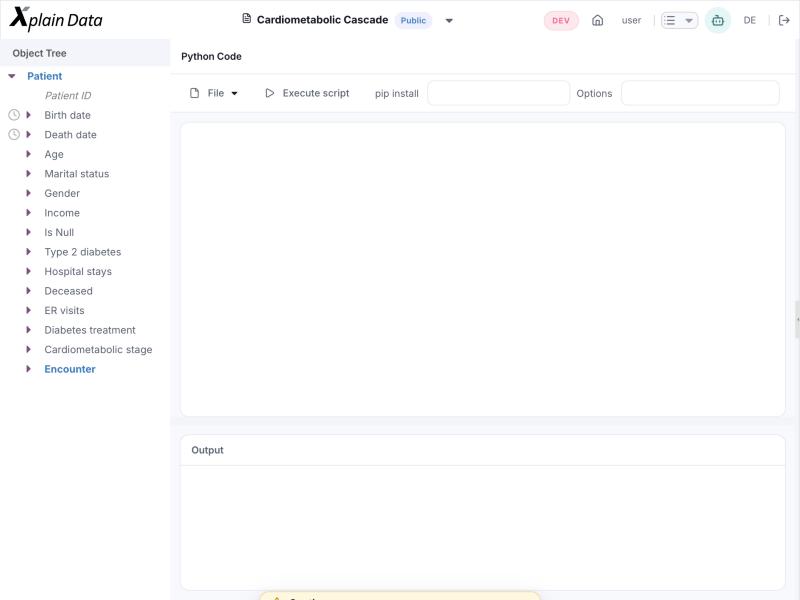
Enter packages that you want to install in “pip install”, for example: “xplain” and enter “–Gender=F” in “Options” to set the gender as F.
Open File → Save script as and save the file as “InteractionXOE”.
Click “Execute script” to run the python script and you will see a newly created chart in xoe.